Crisis management
Question
Where will the flood be in 72 hours?
Deceris
Decision → Evacuation recommendation with priorities and sequencing
47 buildings at risk3 bridges to close2 critical infrastructure components
“Where will the flood be in 72 hours?”
Deceris combines environmental data into a single model of reality - predicts events, simulates outcomes, and recommends concrete operational action in advance.
Specific questions. Specific numbers. Actionable recommendations - drawn from a single model of the physical world.
Where will the flood be in 72 hours?
→ Evacuation recommendation with priorities and sequencing
What happens if the levee breaks at km 12.3?
→ Recommendation: reinforce section 11.8–12.7 km
What is the risk profile of our assets for the next 10 years?
→ Data ready for CSRD report with action priorities
Which routes are available for a heavy convoy?
→ Route recommendation by operational priority
Numbers are illustrative - they show the system’s answer range, not a field deployment.
Historical data is no longer enough. Manual decisions cost more than ever.
Increase in extreme event frequency over the last decade. Historical models are failing.
Critical infrastructure in Europe is over 40 years old. Degradation outpaces repairs.
CSRD, ESG, flood directive - climate risk reporting obligations grow every year.
Organizations managing critical infrastructure still rely on spreadsheets and phone calls.
The cost of one wrong decision is measured in millions.
As part of our collaboration with the Institute of Meteorology and Water Management, we worked on predictive models for ungauged catchments - one of the most challenging problems in hydrology.
This experience made one thing clear: turning data into operational decisions is a challenge - not just in hydrology.
See how the threat monitoring modules, AI analyst, and vast data catalog execute tasks using a real-world example: Flood Analysis.
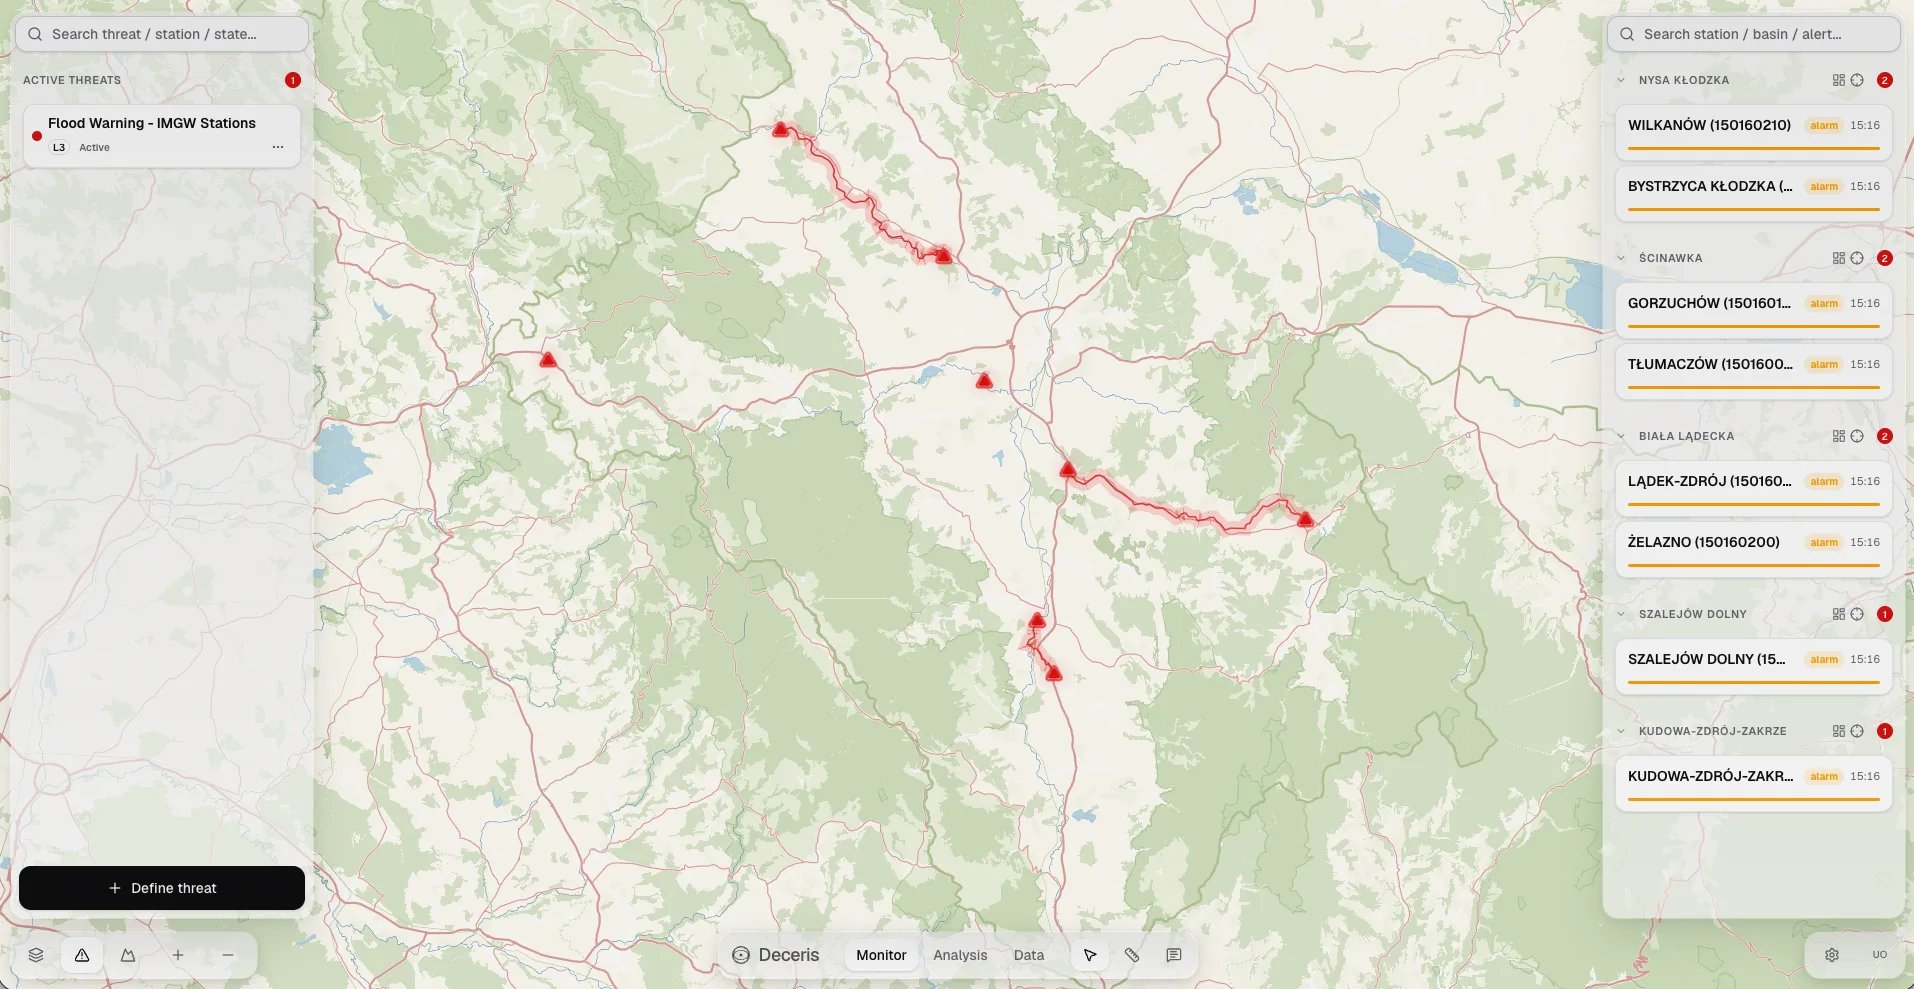
Active threats left, stations with alarm level and detection time right. The map follows rivers - Nysa Kłodzka, Ścinawka, Biała Lądecka.
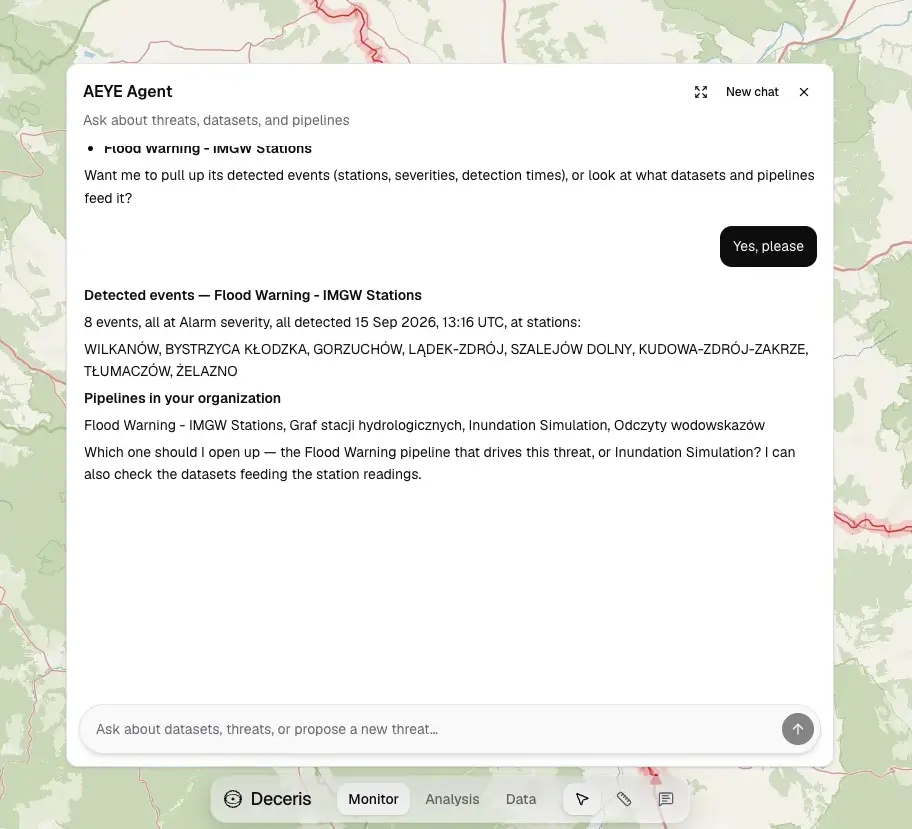
Built-in analyst in chat. It uses tools that create and modify compute pipelines (Prefect) - the core of the Deceris engine.
Can you list active threats?
One active threat: Flood Warning – IMGW Stations. 8 events, Alarm, 15 Sep 2026.
Which pipeline drives this threat?
Flood Warning pipeline + Inundation Simulation. I can open the wiring or check datasets.
AEYE Assistant goes beyond just reading - it is capable of creating pipelines, connecting datasets, and displaying the computational architecture.
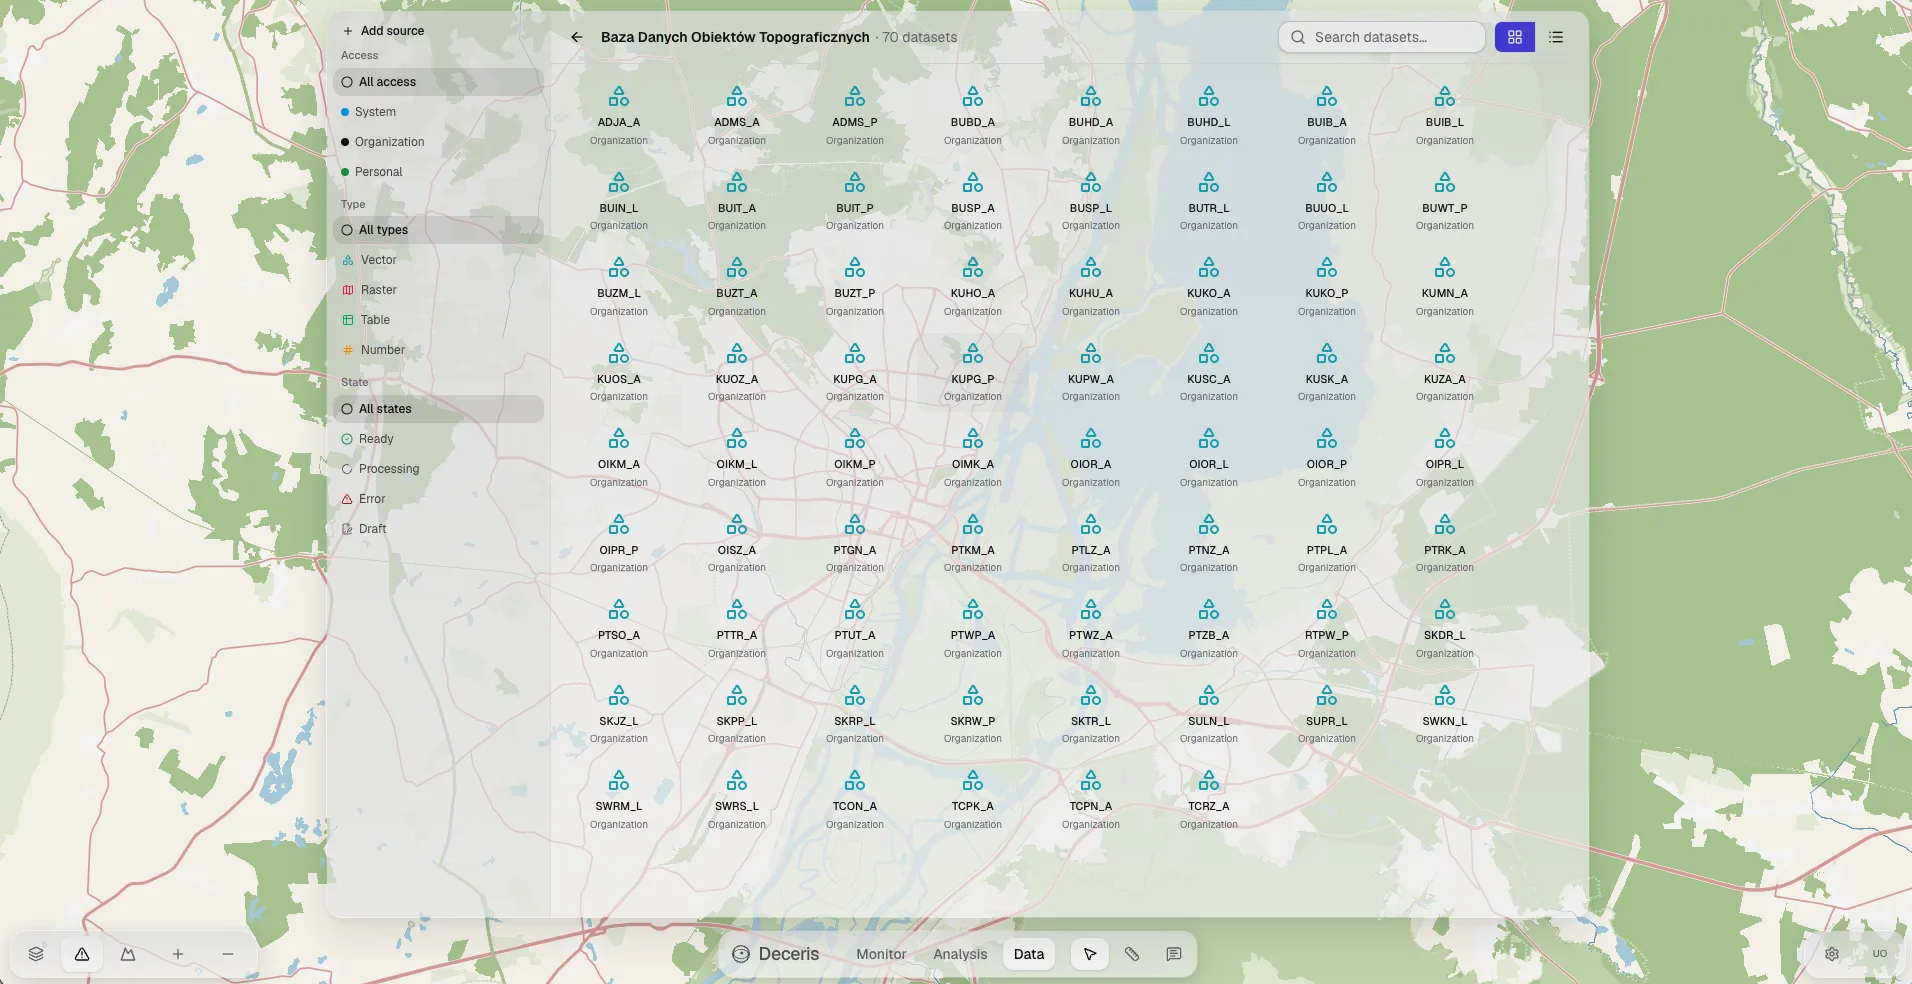
Topographic Objects Database as an organization source. Filters: access, type, state.
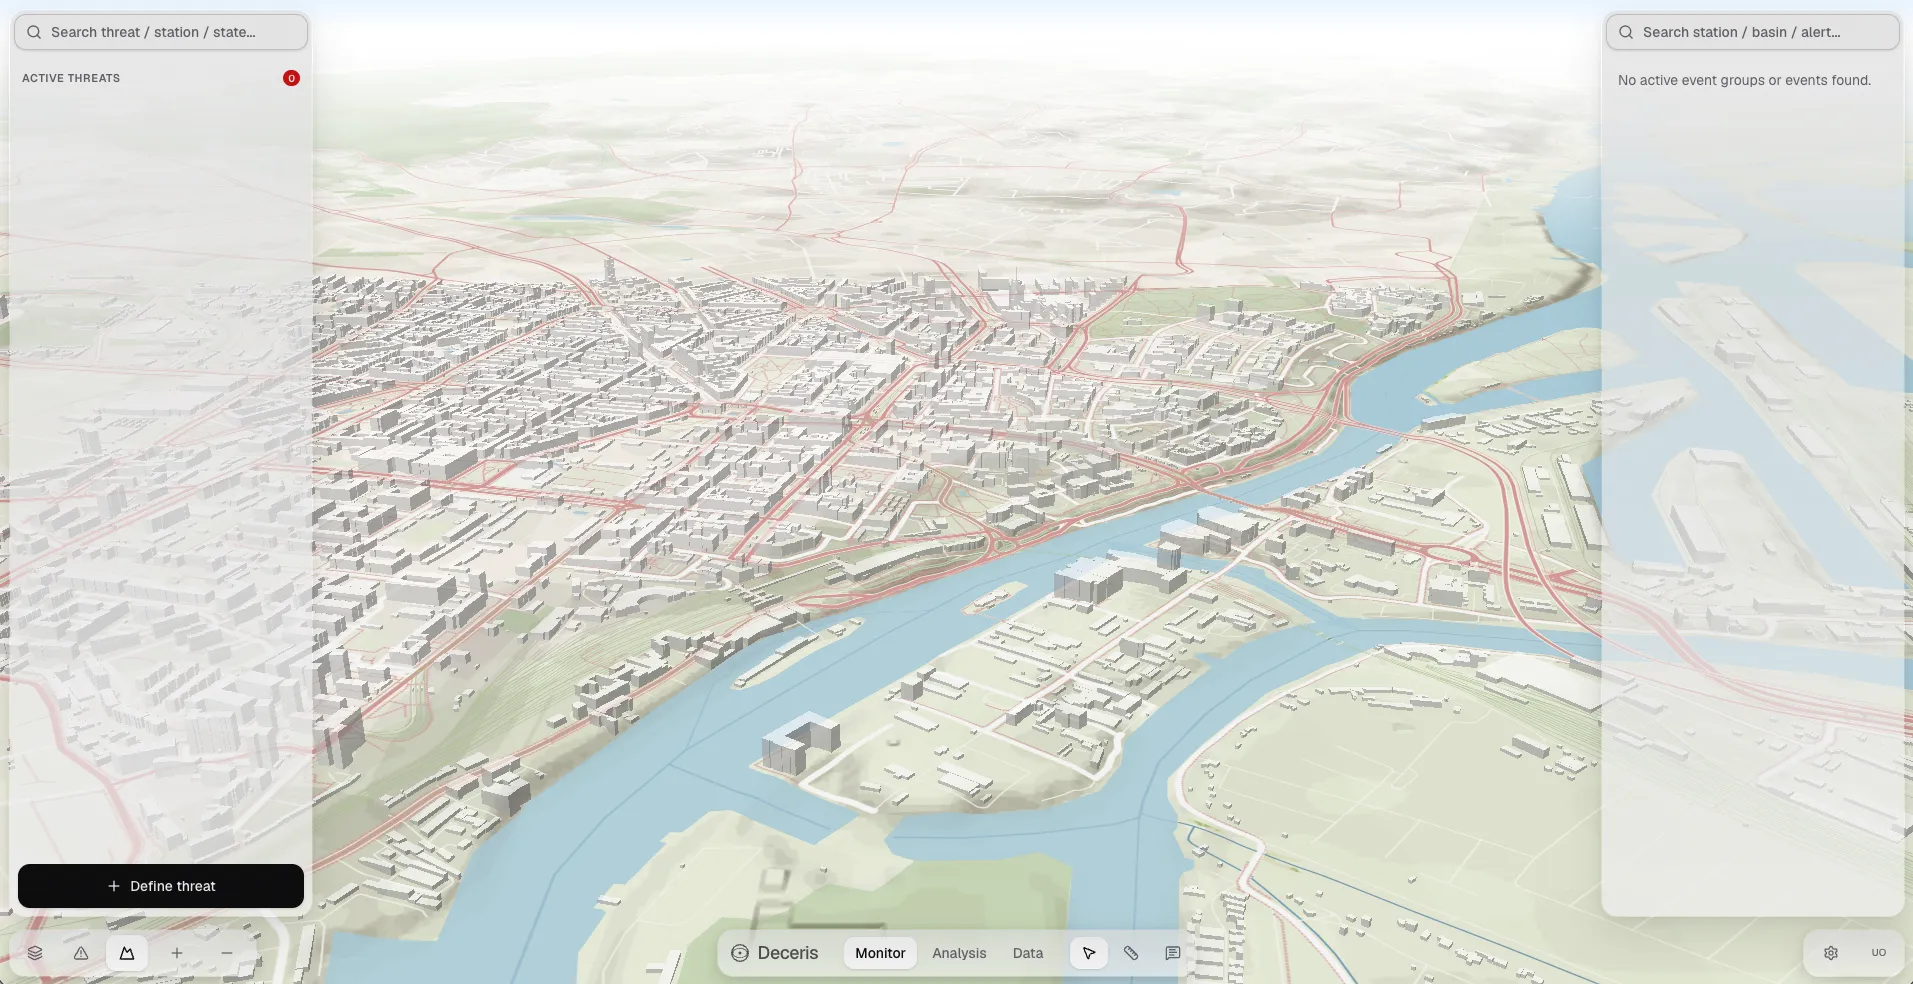
One model, two scenarios: from routine everyday monitoring to advanced crisis management and evacuation.
From raw environmental data streams to a ready operational recommendation.
The system automatically combines satellite, hydrological, terrain, and infrastructure data into a single digital model of reality.
Based on connected data, the system builds an operational model of the physical world - with history, current state, and change forecasts.
You ask a question - the system responds with a concrete decision. Based on simulations, scenarios, and recommendations, it tells you what to do, when, and in what order.
The user doesn’t work with data - they work with decisions.
We don’t visualize data. We build a digital model of the physical world where you can simulate scenarios.
The system gives an answer: what will happen, when, and what to do. It doesn’t leave the user with raw data.
72 hours of lead time is the difference between controlled evacuation and chaos. Between repair and disaster.
You can test every decision in a simulation - see the consequences before they become reality.
Crisis management centers, emergency services, civil protection
Road, bridge, levee, and energy network operators
Network operators, energy companies, natural resource managers
Terrain analysis, geospatial intelligence, operational planning
Cities, municipalities, spatial planning offices, climate units
CSRD-reporting companies, insurers, funds assessing climate risk
We can start with one region or one use case.
We connect data sources - satellite, hydrological, infrastructure. Automatically, without manual collection.
We build a digital model of your operational area - with history, current state, and forecasts.
We run simulations on your data. You ask questions, the system gives answers.
The system goes operational - continuous monitoring, forecasts, real-time recommendations.
We can start with one region or one use case.